Visualization Posts

    Faceted Population Pyramids

    6 minute read

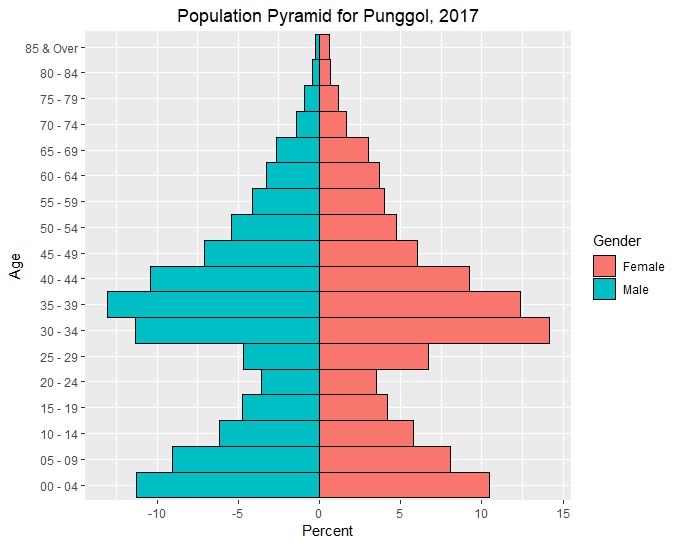
    Population Pyramids are a specific type of bar chart that allows us to easily visualize the age and sex distribution of the population. A population pyramid allows us to clearly distinguish between countries or regions with high fertility (wide py...

    Isochrone Maps with R and OpenTripPlanner

    9 minute read

    Isochrone Maps depict areas of equal travel time from a certain point of departure. They are particularly useful for urban transport and hydrology. For example we can easily visualize how long it would take to travel to a point of interest, like t...

    Bubble Plots to Visualize Singapore Private Property

    7 minute read

    Having seen choropleths and bubble plots, we now examine how to display bubble plots on maps. In particular, we would like to display the location of private properties in Singapore. The Markers vignette for R leaflet gives a quick introduction on...

    Country Stock Market Performance Choropleths with Leaflet for R

    7 minute read

    Choropleths allow the display of statistical variables on shaded regions of maps. For example the GDP of countries or states can be displayed with different color levels. We usually display data according to the geographical administrative subdivi...

    Chord Diagrams in R with chorddiag

    5 minute read

    Chord Diagrams are a beautiful way of visualizing flows between various entities, for example trade and migration flows between nations. Sander and Abel used them effectively in their representation of global migration flows which was published in...

    Ternary Plots in R with Plotly

    6 minute read

    Ternary Plots enable us to visualize 3 parameters simultaneously on a plane. The proportion of the 3 variables must sum up to a constant.

    Bubble Plots in R with Plotly

    8 minute read

    Bubble Plots are an effective way of displaying data over and was used effectively by Hans Rosling in his famous TED Talk. Bubble plots are able to display multiple dimensions of data in an understandable manner. A bubble plot displays the relatio...

    Likert Scales in R with HH and lattice

    3 minute read

    Likert Scales are used to represent survey or psychometric data. Users are asked a series of questions and are asked to give a numerical value for each question. User responses to multiple questions are centered around the neutral mark and they ar...

    Mosaic Plots in R with ggplot2

    6 minute read

    Mosaic diagrams or MariMekko diagrams are an alternative to bar plots . Traditional bar plots have categories on one axis and quantities on the other. If we have 2 categories we would normally use multiple bar plots to display the data. With mosai...