Likert Scales in R with HH and lattice
Introduction
Likert Scales are used to represent survey or psychometric data. Users are asked a series of questions and are asked to give a numerical value for each question. User responses to multiple questions are centered around the neutral mark and they are an easy way to see survey responses are positive or negative.
Data
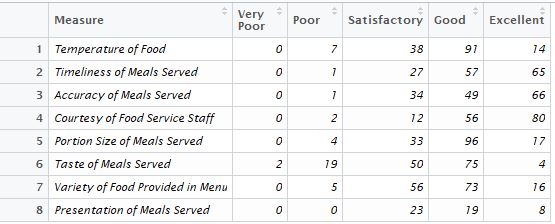
We have a series of questions about the quality of food in a school. Students are asked to rate the food and service as very poor, poor, satisfactory, good and excellent. A total of 8 questions were asked.
Likert scales
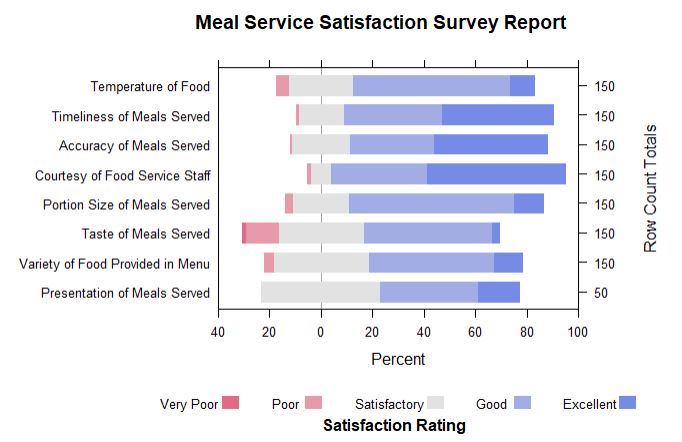
The HH Packge by Heiberger and Holland implements the Likert scale function. Note that the ReferenceZero variable of likert determines the response value which will be set as the reference. For our data, we choose ReferenceZero=3 as there are 5 possible responses to the survey. The likert function also gives the number of responses for each question; in our case there are 150 responses, except for Presentation of Meals Served which only had 50 responses.
require(grid)
require(lattice)
require(latticeExtra)
require(HH)
SurveyData<-read.csv('SurveyData.csv')
likert(Measure ~ .,data=SurveyData,ylab=NULL, ReferenceZero=3,
  as.percent=TRUE,
  main = list("Meal Service Satisfaction Survey Report",x=unit(.55, "npc")),
  sub= list("Satisfaction Rating",x=unit(.57, "npc")),
   xlim=c(-40,-20,0,20,40,60,80,100), strip=FALSE,
   par.strip.text=list(cex=.7))
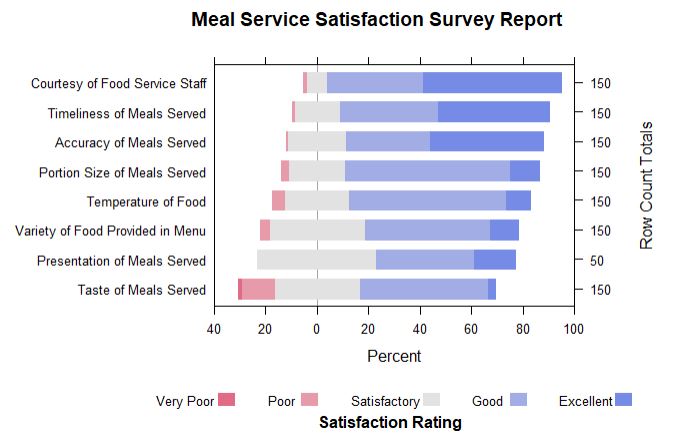
The questions can be ordered from the most positive by setting the positive.order variable to TRUE
likert(Measure ~ .,data=SurveyData,ylab=NULL, ReferenceZero=3,
  as.percent=TRUE, positive.order=TRUE,
  main = list("Meal Service Satisfaction Survey Report",x=unit(.55, "npc")),
  sub= list("Satisfaction Rating",x=unit(.57, "npc")),
   xlim=c(-40,-20,0,20,40,60,80,100), strip=FALSE,
   par.strip.text=list(cex=.7))
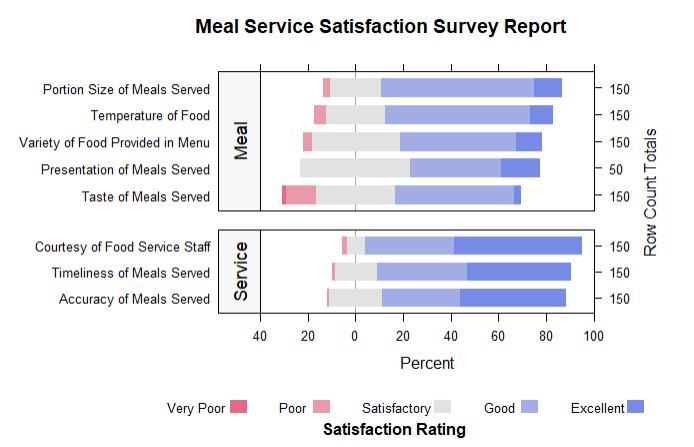
The likert function also allows us to split the questions into different categories. For our survey, note that the questions are either related to the level of service or to the quality of food.
Type <-c("Meal","Service","Service","Service","Meal","Meal","Meal","Meal")
SurveyData_Type<-cbind(SurveyData,Type)

likert(Measure ~ .| Type,data=Oct_df2, layout=c(1,2),
 scales=list(y=list(relation="free")),between=list(y=1),
 strip.left=strip.custom(bg="gray97"), strip=FALSE,
 par.strip.text=list(cex=1.1, lines=2), ylab=NULL, cex=1.2,
ReferenceZero=3,as.percent=TRUE, positive.order=TRUE,
main = list("Meal Service Satisfaction Survey Report",x=unit(.55, "npc")),
sub= list("Satisfaction Rating",x=unit(.57, "npc")),
xlim=c(-40,-20,0,20,40,60,80,100),resize.height.tuning=1)
Refer to this article by Heiberger and Robbins for explanations about the likert scale function in HH.