Recent Posts

Chord Diagrams in R with chorddiag

5 minute read

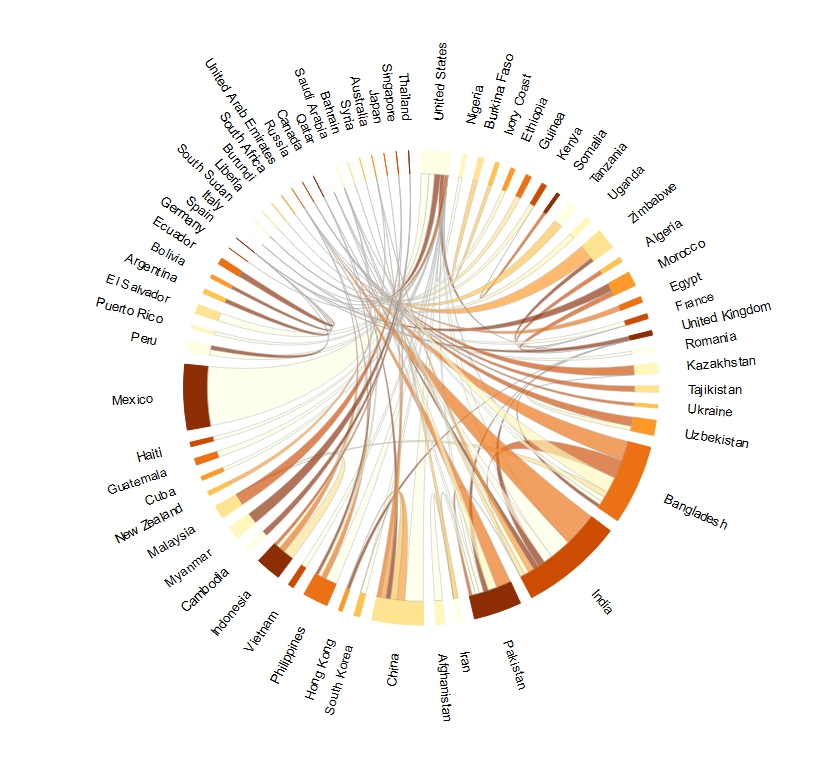
Chord Diagrams are a beautiful way of visualizing flows between various entities, for example trade and migration flows between nations. Sander and Abel used them effectively in their representation of global migration flows which was published in...

Ternary Plots in R with Plotly

6 minute read

Ternary Plots enable us to visualize 3 parameters simultaneously on a plane. The proportion of the 3 variables must sum up to a constant.

Imbalanced datasets with imbalanced-learn

19 minute read

Machine learning classification algorithms tend to produce unsatisfactory results when trying to classify unbalanced datasets. The number of observations in the class of interest is very low compared to the total number of observations. Examples o...

Bubble Plots in R with Plotly

8 minute read

Bubble Plots are an effective way of displaying data over and was used effectively by Hans Rosling in his famous TED Talk. Bubble plots are able to display multiple dimensions of data in an understandable manner. A bubble plot displays the relatio...

Likert Scales in R with HH and lattice

3 minute read

Likert Scales are used to represent survey or psychometric data. Users are asked a series of questions and are asked to give a numerical value for each question. User responses to multiple questions are centered around the neutral mark and they ar...