Recent Posts

Bubble Plots to Visualize Singapore Private Property

7 minute read

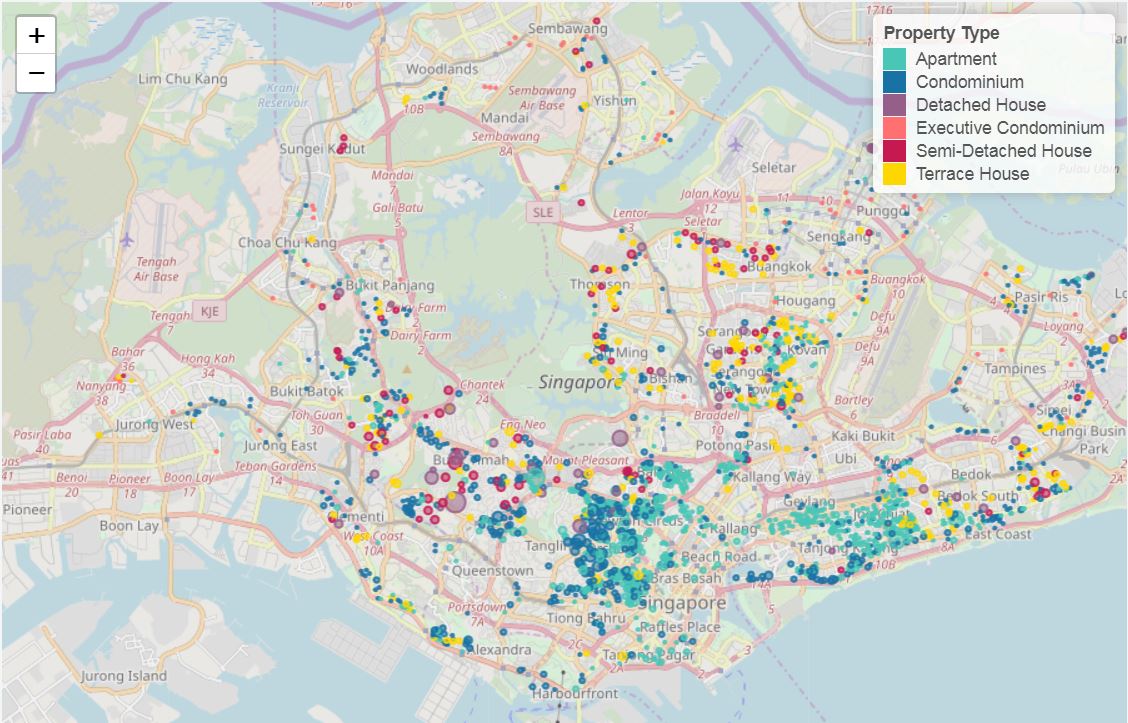
Having seen choropleths and bubble plots, we now examine how to display bubble plots on maps. In particular, we would like to display the location of private properties in Singapore. The Markers vignette for R leaflet gives a quick introduction on...

Using Multiprocessing to speed up web scraping

7 minute read

Webscraping or calling APIs to collect data can take significant amounts of time due to the quantities of data involved. We previously saw how we could build a simple web scraper to collect data from Finviz. Depending on the number of tickers that...

Webscraping Finviz with Beautiful Soup and Requests

6 minute read

Machine learning algorithms are only as good as the data available. Bringing in additional data can give us better insights and improve performance when we have maxed out the performance of the machine learning algorithms. One way to obtain additi...

Country Stock Market Performance Choropleths with Leaflet for R

7 minute read

Choropleths allow the display of statistical variables on shaded regions of maps. For example the GDP of countries or states can be displayed with different color levels. We usually display data according to the geographical administrative subdivi...